Pepe coin price could rise 45% as exchange volume slips

Pepe coin price has retreated by over 27% from its highest level this year, but the ongoing whale activity and exchange supply may push it higher.
Pepe (PEPE), the third-biggest meme coin, was trading at $0.0000187 on Wednesday, Nov. 27, bringing its market cap to over $7.8 billion.
Data by Nansen, a top analytics platform, shows that the Pepe coins on exchanges stood at 239.84 trillion, down by 1.46% from where they were last week. The total supply represents about 57% of the total supply.
Nansen data shows that most of these coins are in Binance, Bybit, OKX, Crypto.com, and Robinhood. The numbers also showed that Pepe had a CEX outflow of $9.19 million in the last 24 hours.
Crypto outflows from exchanges are seen as a positive thing in the cryptocurrency industry because it is a sign that many investors hope to hold it for longer.
Meanwhile, on-chain data shows that whales continued buying Pepe. One of these whales bought coins worth over $2.7 million on Wednesday. Another whale moved coins worth almost $1 million from Binance.
The other potential catalyst for Pepe coin price is its substantial volume compared to other meme coins. It had a 24-hour volume of $2.9 billion, making it second only to Dogecoin (DOGE), which had $8 billion in volume.
Pepe price break and retest completes

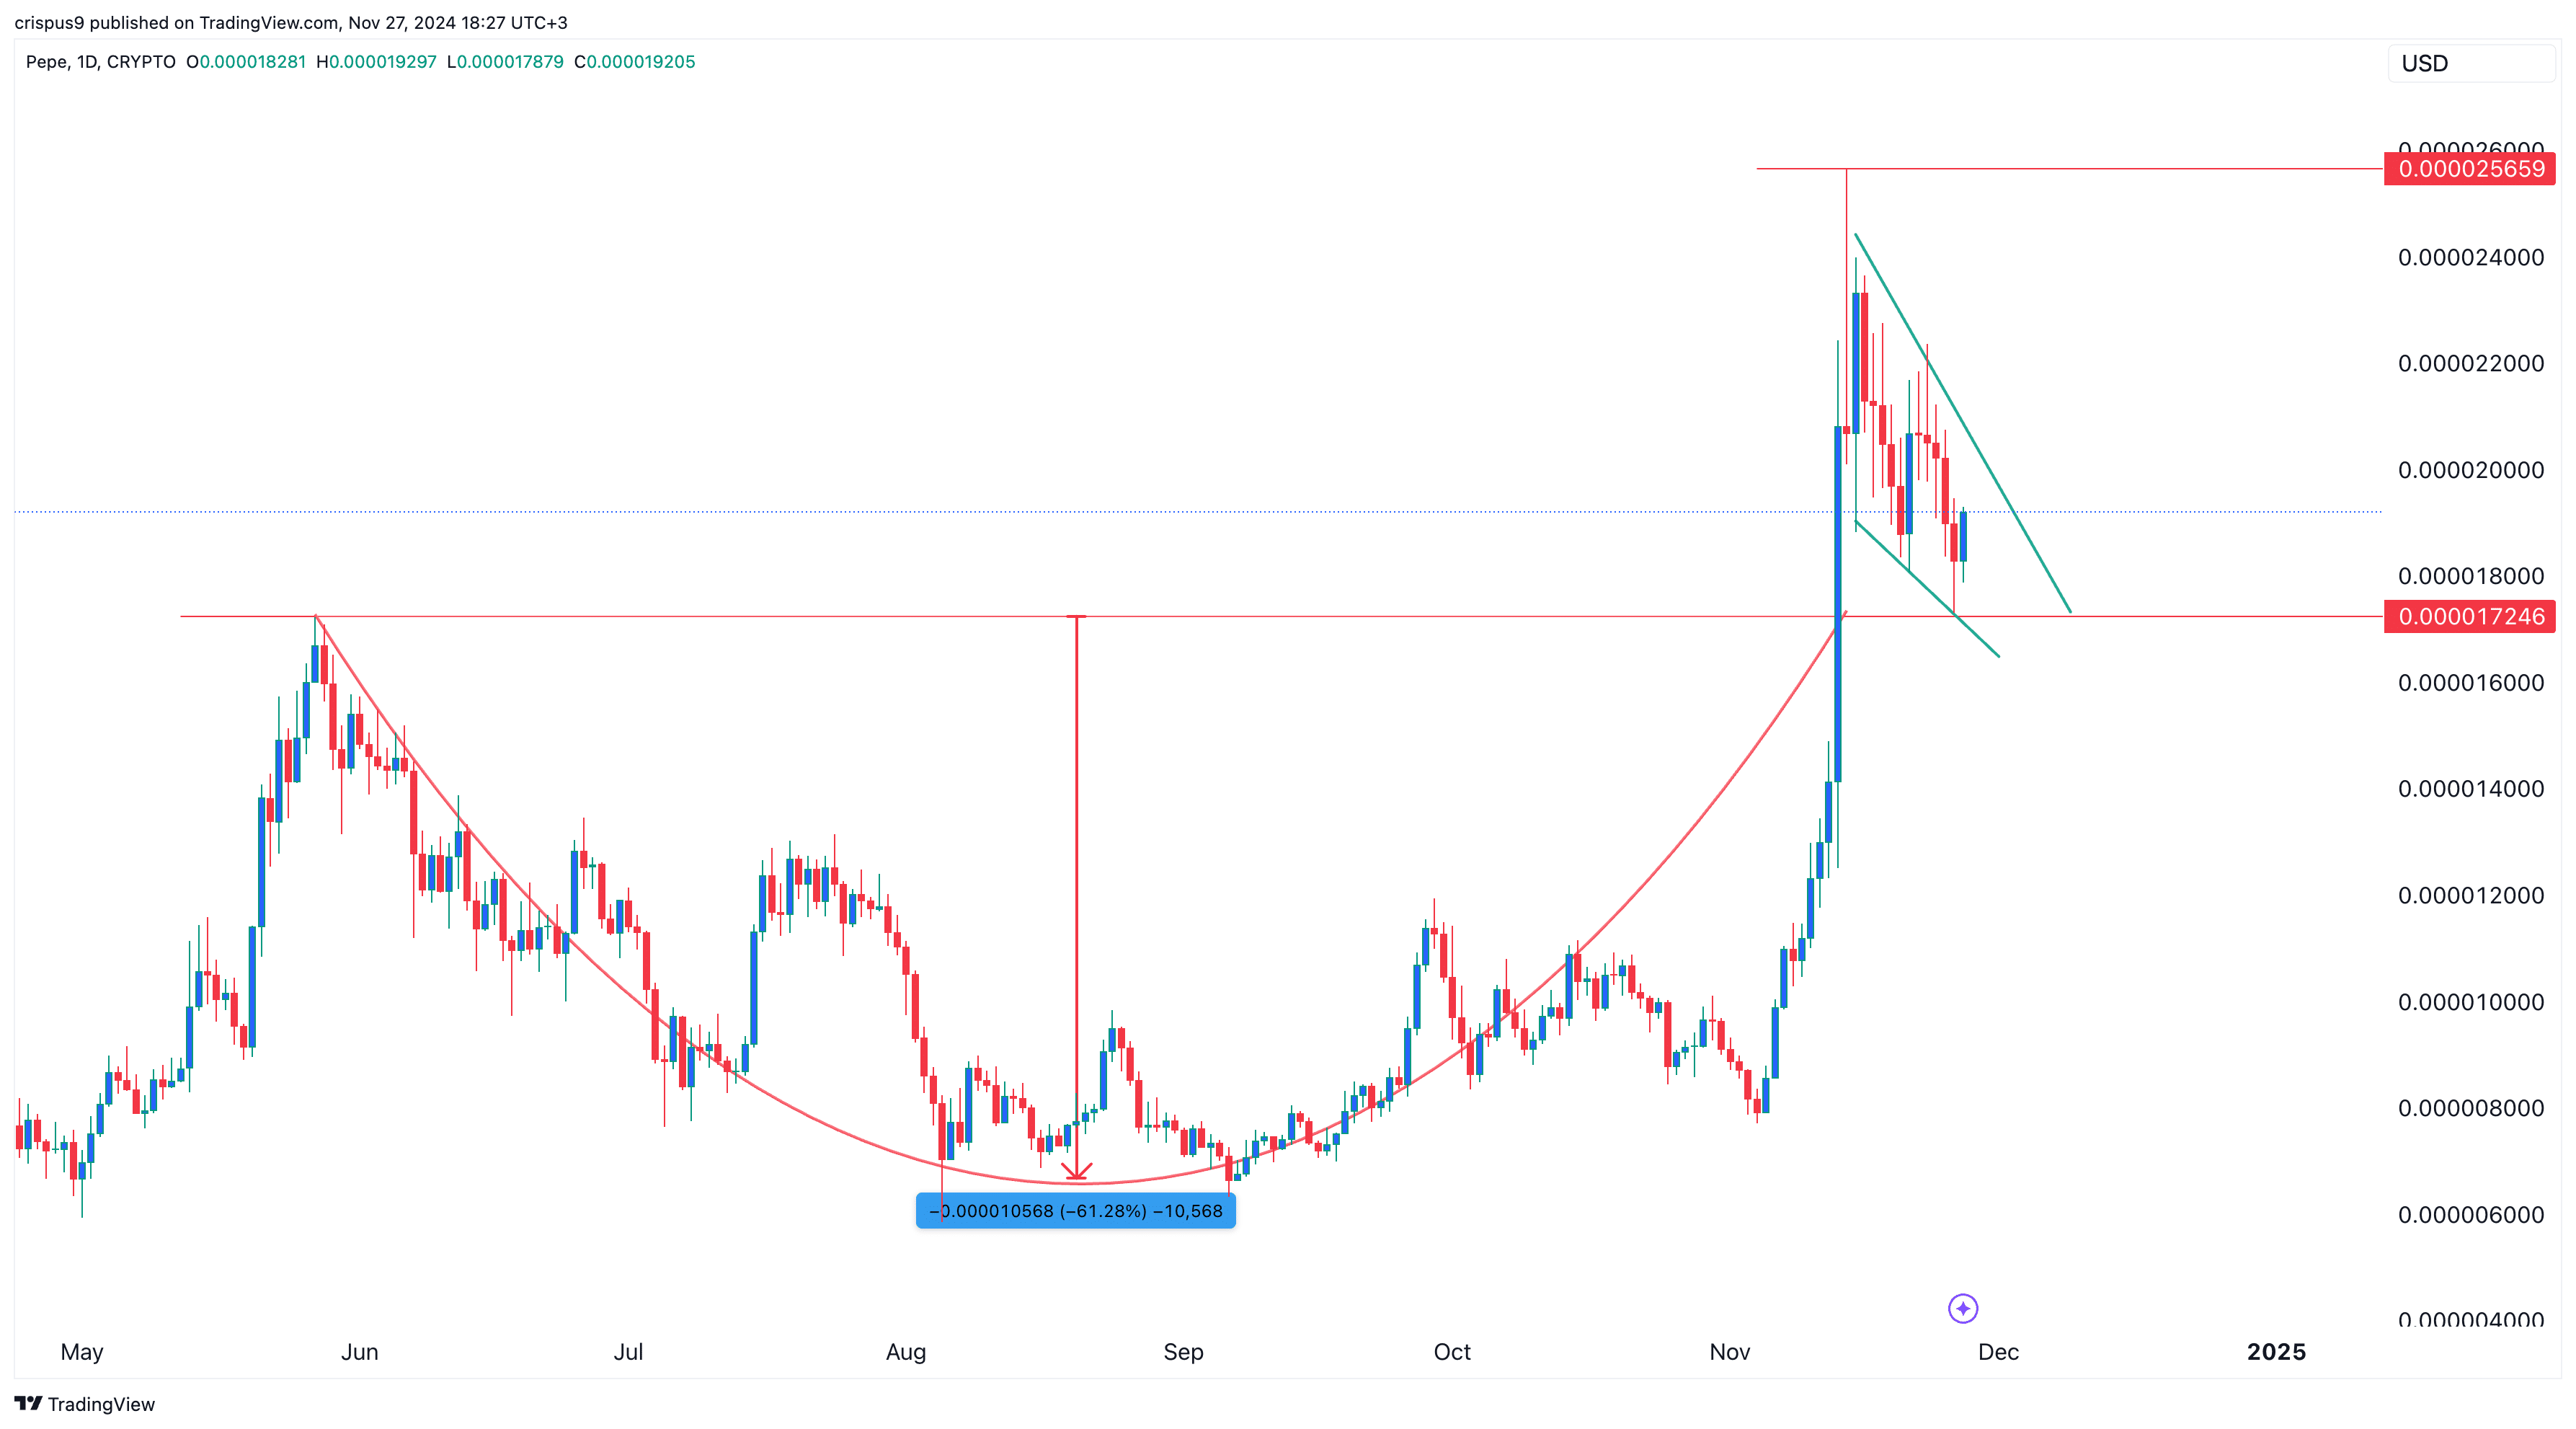
Technically, Pepe has just completed the break and retest pattern. This is a situation where a coin rises above a key resistance level and then retests it. It is a common sign of a bullish continuation pattern. In this case, it dropped and retested the support at $0.0000172, its highest level in March 2024, and the upper side of the cup and handle pattern.
By measuring the depth of the cup, we can estimate that the next Pepe price forecast is $0.000028, which is about 45% above the current level. Further supporting the bullish case is the fact that Pepe has formed a falling wedge chart pattern and a small morning star.
A wedge, which is shown in green above, is made up of two falling and converging trendlines and is a popular bullish reversal pattern. A morning star is a candlestick pattern that has a small body and upper and lower shadows. These patterns point to a potential bullish breakout in the next few weeks. The initial target will be the year-to-date high of $0.000025, followed by $0.0000172.


